阿里统计图表库G2Plot
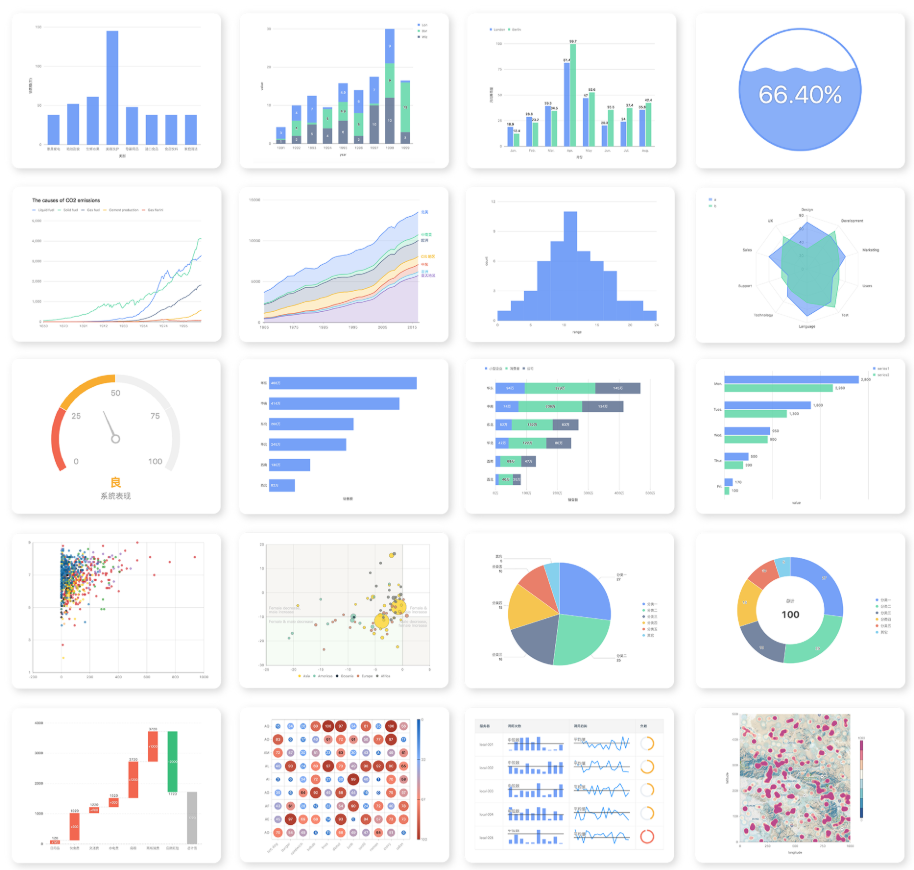
G2Plot中的 G2 即意指图形语法 (the Grammar of Graphics),同时也致敬了 ggplot2。G2Plot是阿里的一套简单、易用、并具备一定扩展能力和组合能力的统计图表 JS 库,基于图形语法理论搭建而成。G2Plot吸引我的优点有:一、代码简单易用。二、大数据展示更智能,避免文本的重叠遮挡、内容无法自适应、内容裁剪等问题。三、提供了多图表组合、叠加、联动,共同讲述一个数据故事的可能性。下面雷雪松带大家一起了解下阿里统计图表库G2Plot。
1、npm安装G2Plot
[cc lang=”bash” escaped=”true”][root@node ~]# npm install @antv/g2plot[/cc]
2、G2Plot使用
[cc lang=”html” escaped=”true”]<div id=”container”></div>[/cc]
[cc lang=”javascript” escaped=”true”]import { Bar } from ‘@antv/g2plot’;
const data = [
{ year: ‘1951 年’, sales: 38 },
{ year: ‘1952 年’, sales: 52 },
{ year: ‘1956 年’, sales: 61 },
{ year: ‘1957 年’, sales: 145 },
{ year: ‘1958 年’, sales: 48 },
];
const bar = new Bar(document.getElementById(‘container’), {
data,
xField: ‘sales’,
yField: ‘year’,
colorField: ‘year’,
});
bar.render();[/cc]
2020年10月3日 上午10:45
空包单号网全国地址任意发,24小时自助下单,快速免费提供底单www.dydanhw.com
2020年10月22日 上午8:56
快递代发,礼品代发单号无忧为您解决www.dh5u.com
2021年1月14日 下午2:59
博主整理不易,感谢分享
2022年6月12日 上午11:31
小编不容易 点赞
2022年6月13日 上午11:10
小编很久没有更新了